This
dataset
is a subgraph of the Amazon co-purchase Amazon Network [1] . We
filtered products from the Disney category and we extend the
product information with product prices extracted from the
Amazon website on March 2012. A list of the attributes and their
description can be found
here.
| Number
of nodes |
124 |
| Number
of edges |
334 |
| Average
clustering coefficient |
0.437 |
| Dimensions |
30 |
User Experiment
Pre-Configuration:
- First, we clustered the
Amazon subgraph with a modularity based
technique
[2].
Thus, we have ensured that
students do not label global outliers (e.g., product with the highest
price of the database). but they label contextual outliers inside
graph clusters. (The file with the obtained graph clusters can be found
here)
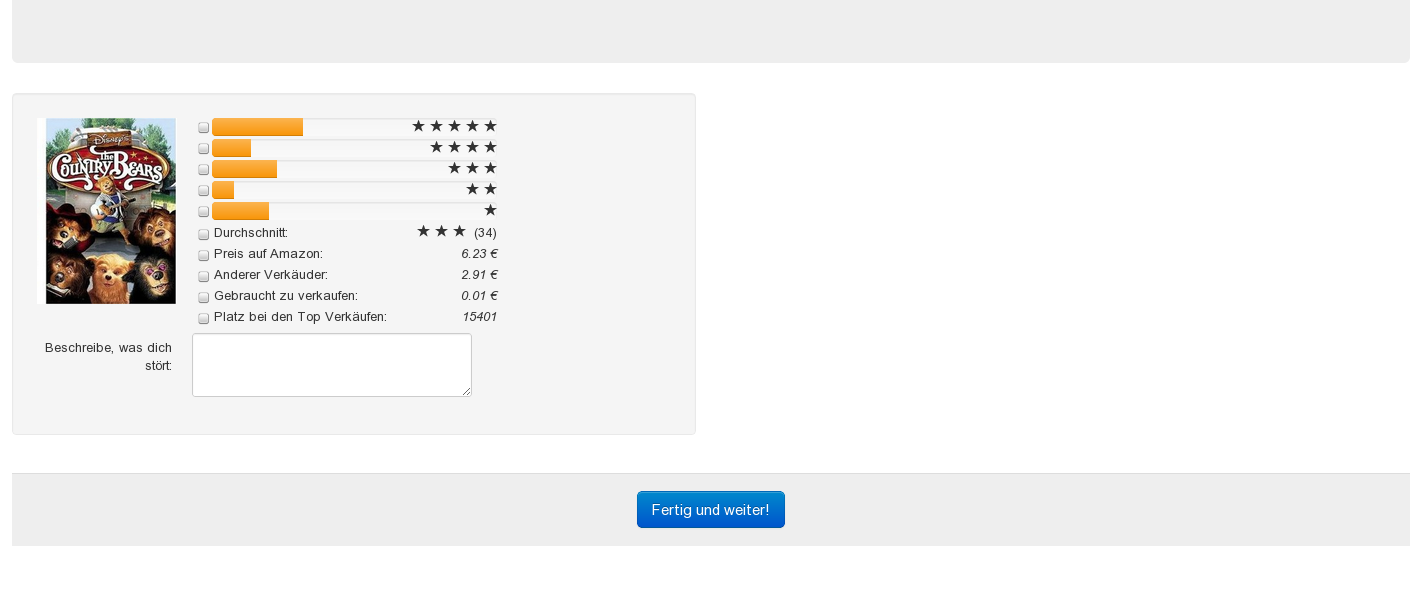
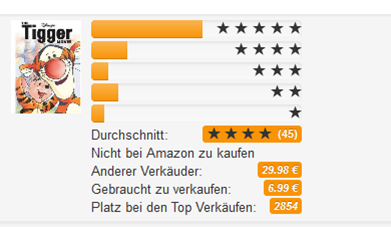
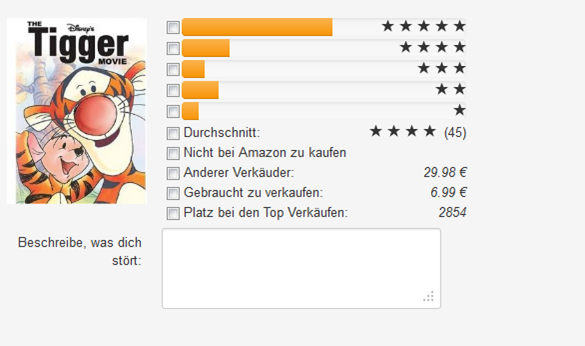
- We choose those attributes
which are available on the Amazon
website (not aggregated attributes) , and we translate them into German
in order to provide a product
description to the students.
Experiment Sequence:
- For each graph cluster (in
total 8 clusters) :
a. All
products in a graph cluster were shown to the students in
the browser.
b. Each group
of two students had to choose 1 or 2 products that they considered
unexpected, rare
or suspicious in
the group.
c. For each
labeled product, the two students had to fill out a
form
with the reasons and the
attributes they considered rare.
Results: All results of the
experiment with the
German comments of the students can be found here.
Experimental Evaluation
For the evaluation, we selected those products, where at least 50% of
the students considered the products as outliers inside the group
(in total 6
outliers were selected).
Evaluation with traditional
techniques on relational data only
First, we evaluate the results with traditional outlier detection
techniques provided by the
SOREX
toolkit. We used the relational
dataset,
without
the information of the graph structure. For the evaluation of the
detection quality we use the
true file
as outlier
labels. The
configurations of the algorithms used can be found
in the
following table:
| Algorithm |
Parameters |
| LOF |
weka.outlier.LocalOutlierFactor
-L 20
-U 20 |
| SOF |
weka.outlier.AggraWal
-S 20 -P 10 |
|
RPLOF |
weka.outlier.RPLOF -L 20 -U 20 -X 1 |
Evaluation with other
competitors considering the graph structure
Finally, we also considered the
dataset
with the graph structure in
order to evalute our approach
and other competitors. The settings are shown in the following table:
| Algorithm |
Parameter |
| SCAN |
µ=
2,ε=0.5 |
| CODA |
k=8, r =
6/124 , λ=0.1 |
Evaluation considering
different clusterings
We evaluate our scoring functions using the results provided by graph
subspace clustering techniques. The implementation of all these
algorithms can be found
here.
The properties fles for the execution of each of the algorithms are
shown in the following table:
[1] J. Leskovec, L. Adamic and B. Adamic. The Dynamics of
Viral Marketing. ACM Transactions on the Web (ACM TWEB), 1(1), 2007.
[2] Vincent D Blondel, Jean-Loup Guillaume, Renaud Lambiotte,
Etienne Lefebvre, Fast unfolding of communities in large networks, in
Journal of Statistical Mechanics: Theory and Experiment 2008 (10), P1000
Access
to this website
After publication of this work in April 2013,
we encourage researchers in this
area to use the proposed algorithm for their own publications as
competitor. Our implementation will then be available for
anyone
to use. Thus, all algorithms, data sets and parameter setting will be
available for the community.
